Previously: Adding kubernetes logging (fluentd)
Tuning resource usage
We now have a full-functional cluster, producing metrics, logging, running applications, the whole ball of wax! We are now in the place where we can start to tune the performance characteristics of our cluster.
I have just started down this path myself, and as such, I don't have a lot of experience with the current cluster as it is running. It is just being rolled out into production now and so over the next days, weeks, and months, we will be learning how to monitor the performance of the cluster and making adjustments to the CPU and Memory requests that we can define in our pods.
I will be adding to this article as I learn but I also wanted a place to publicly share some links that I find and like.
Basic Resource Requests
Going back one chapter to the fluentd pulumi declarations, we can see that in the DaemonSet resource, we are describing requests and limits for our pod resources.
1 | resources: { |
You can use these requests and limits in any pod spec and you can make adjustments as you learn. Just a reminder, pods are intended to be ephemeral and any changes will cause pods to go be deleted and new replacements are created. You can make changes in your pulumi application, do a quick pulumi up and see the difference in node resource consumption nearly immediately.
Monitoring Resource Usage
It's important to remember that pods use node resources, so if you are going to monitor resources, they would be at the cluster/node level and not any particular application or namespace.
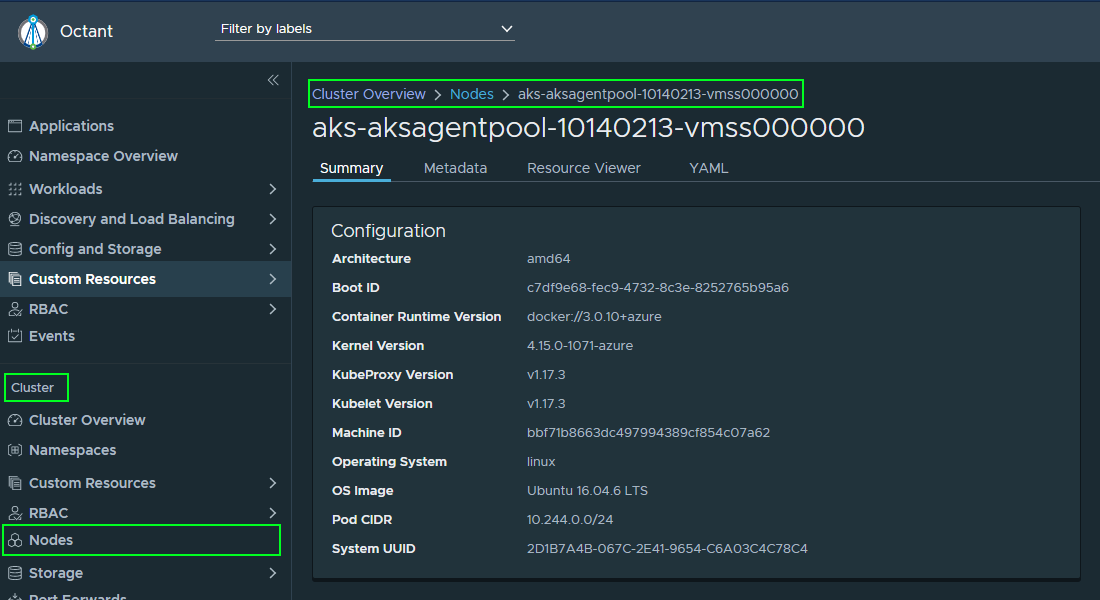
Using Octant, we can navigate to a node to get a sense of how it is doing.
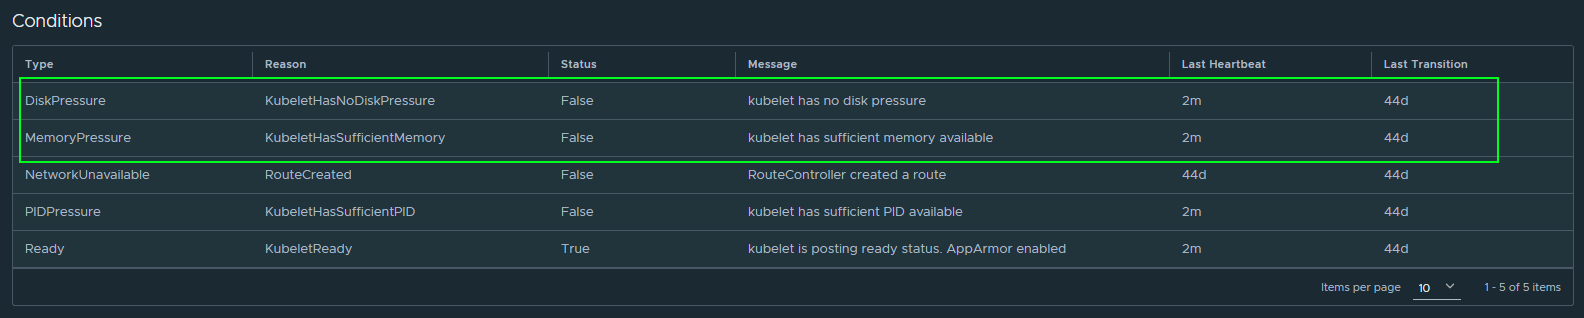
On the same node details page, we can find a section called Conditions where k8s is telling you how it feels about the current resources available vs. allocated. I don't have any ideas or guidance yet on what these ratios should be yet.
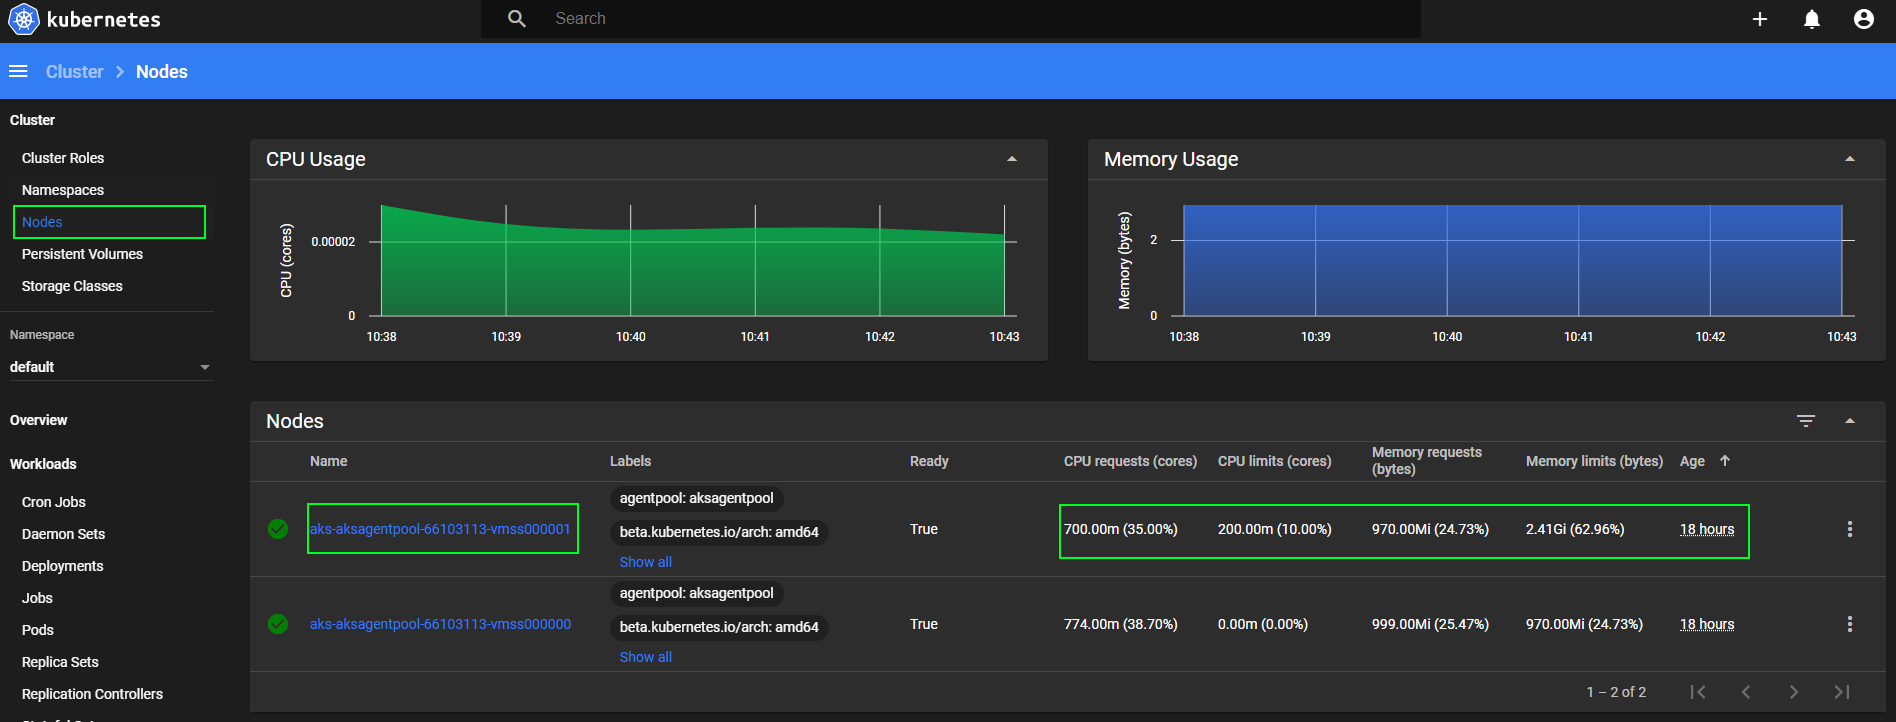
I've actually found that I really like the Kubernetes Dashboard WebUI is a great place to also look at resource utilizations and configurations.
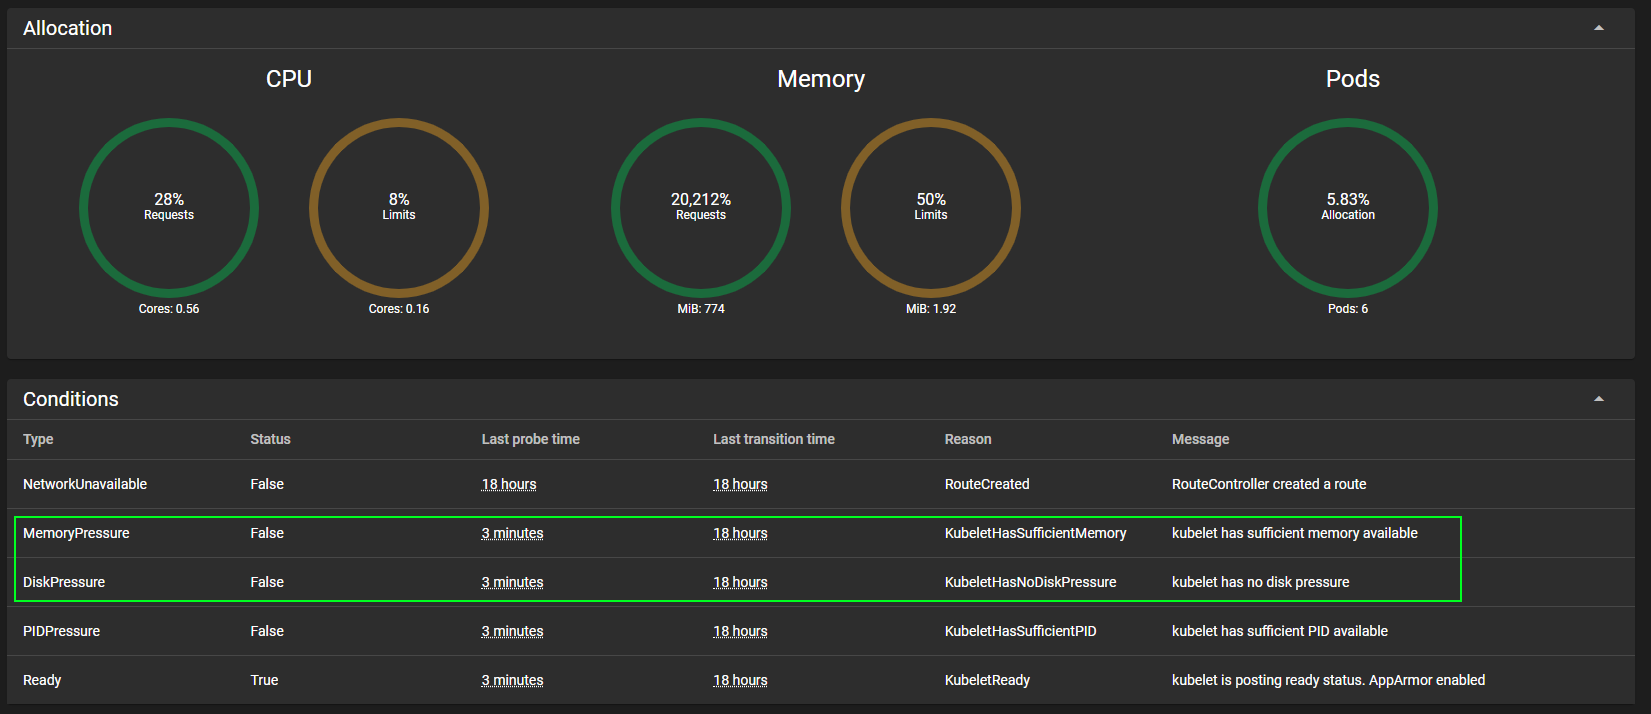
Clicking into a single node gives details about Conditions on that node.
Summary
As mentioned, this is certainly a work in progress. As we monitor the cluster and how it behaves, we'll make adjustments. I'm certain we'll also make adjustments as to how we monitor. I expect at least one prometheus article in the near future, so I'll just leave the Next Up link space at the bottom of the article as TBD. :D
Links to Articles
Next up:
TBD
